


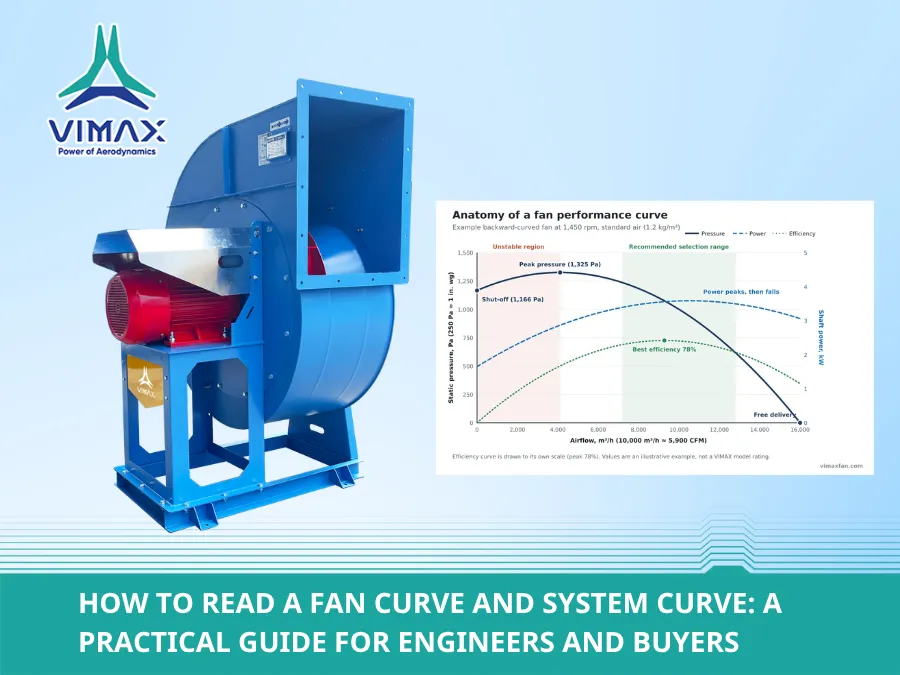
A fan datasheet that says “10,000 m³/h” tells you almost nothing on its own. The same fan can deliver 9,000 m³/h in one building and 11,000 m³/h in another, because airflow depends on two things: what the fan can do, shown by its fan curve, and what the ductwork demands, shown by the system curve. The fan always runs where those two curves cross.
This guide explains how to read both curves, how to find the operating point, how speed changes move it, and which mistakes cause most “the fan doesn’t deliver” complaints. A worked example in m³/h and Pa (with CFM and in. wg equivalents) runs through the whole article, so every figure uses the same numbers.
Key Takeaways
- The fan curve shows the static pressure a fan can develop at each airflow, at one speed and one air density. Power and efficiency curves are usually drawn on the same chart.
- The system curve shows the pressure the ductwork needs at each airflow. For normal turbulent duct flow, pressure rises with the square of airflow: double the airflow and you need four times the pressure.
- The operating point is where the two curves cross. You cannot choose it on the fan alone — change the ductwork, filters or dampers and the point moves.
- Select to the right of the pressure peak, close to best efficiency. The region left of the peak is unstable and should be avoided.
- Fan laws: airflow changes with speed, pressure with speed², and power with speed³. In our example, running at 80% speed cuts power to about 51%.
- Add system effect. Poor inlet and outlet conditions cut real performance below the catalogue curve, so they must be allowed for at the design stage.
Anatomy of a Fan Curve
A fan curve is built in a test laboratory. The fan runs at a fixed speed while a test rig adds more and more resistance; each level of resistance gives one point of airflow and pressure, and connecting the points produces the curve. Reputable manufacturers test to a recognised standard such as AMCA 210 or ISO 5801, and publish the result for standard air (1.2 kg/m³, or 0.075 lb/ft³).
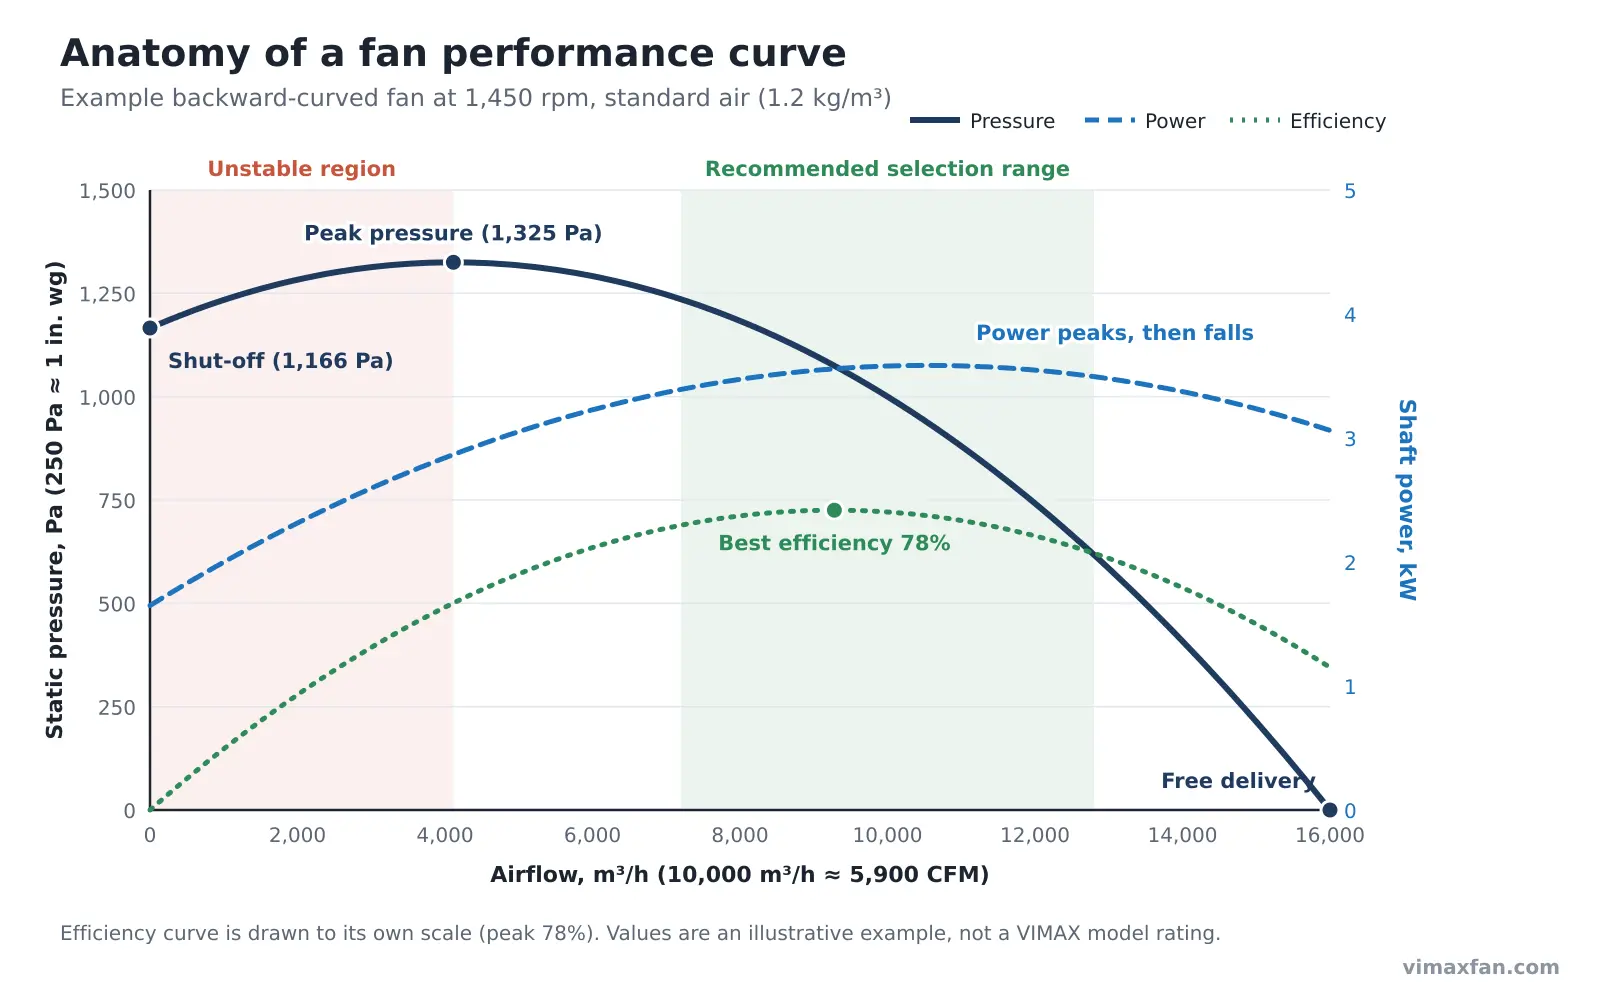
Read the chart from left to right:
- Horizontal axis – airflow: m³/h, m³/s or CFM (1 m³/s = 3,600 m³/h ≈ 2,119 CFM).
- Vertical axis – pressure: usually static pressure in Pa or in. wg (249 Pa = 1 in. wg). Some charts show total pressure; check which one before you compare fans, because total pressure includes the velocity pressure at the outlet and always reads higher.
- Shut-off point: the left end of the curve, where the outlet is fully blocked. The fan develops pressure but moves no air. In the example, shut-off is 1,166 Pa.
- Peak pressure: the highest point of the curve — 1,325 Pa at about 4,100 m³/h in the example.
- Unstable region: the part of the curve left of the peak. Here the airflow can surge back and forth, the fan becomes noisy and the blades see pulsating loads. Never select a fan in this region.
- Free delivery: the right end of the curve, where the fan blows into open air with no resistance — 16,000 m³/h in the example. No real system operates here.
- Efficiency curve: peaks at one airflow, the best efficiency point (BEP). The example fan reaches 78% at about 9,300 m³/h.
- Power curve: the shaft power the motor must deliver. In a backward-curved fan it rises to a peak and then falls (non-overloading); in forward-curved and radial fans it keeps rising with airflow. See Forward-Curved vs Backward-Curved vs Radial Impellers for why.
The green band in Figure 1 is the practical selection range: right of the pressure peak, close to the best efficiency point. A fan selected there runs stable, quiet and efficient, and still has margin if the system resistance turns out a little different from the design.
Two conditions are fixed on every curve: the fan speed (rpm) and the air density. Change either one and the curve changes — which is why a hot-gas fan or a fan installed at altitude cannot be selected straight from a catalogue curve for standard air.
What Is a System Curve?
The system curve describes the resistance of everything the air passes through: ducts, elbows, hoods, filters, dampers, coils, silencers and the discharge stack. Engineers calculate the total pressure loss at the design airflow; the system curve extends that one point to every other airflow.
Air in industrial ductwork is almost always turbulent, and turbulent pressure loss rises with the square of velocity. So for a fixed system:
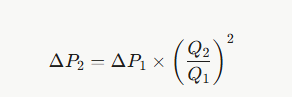
where ΔP is the system pressure loss and Q the airflow.
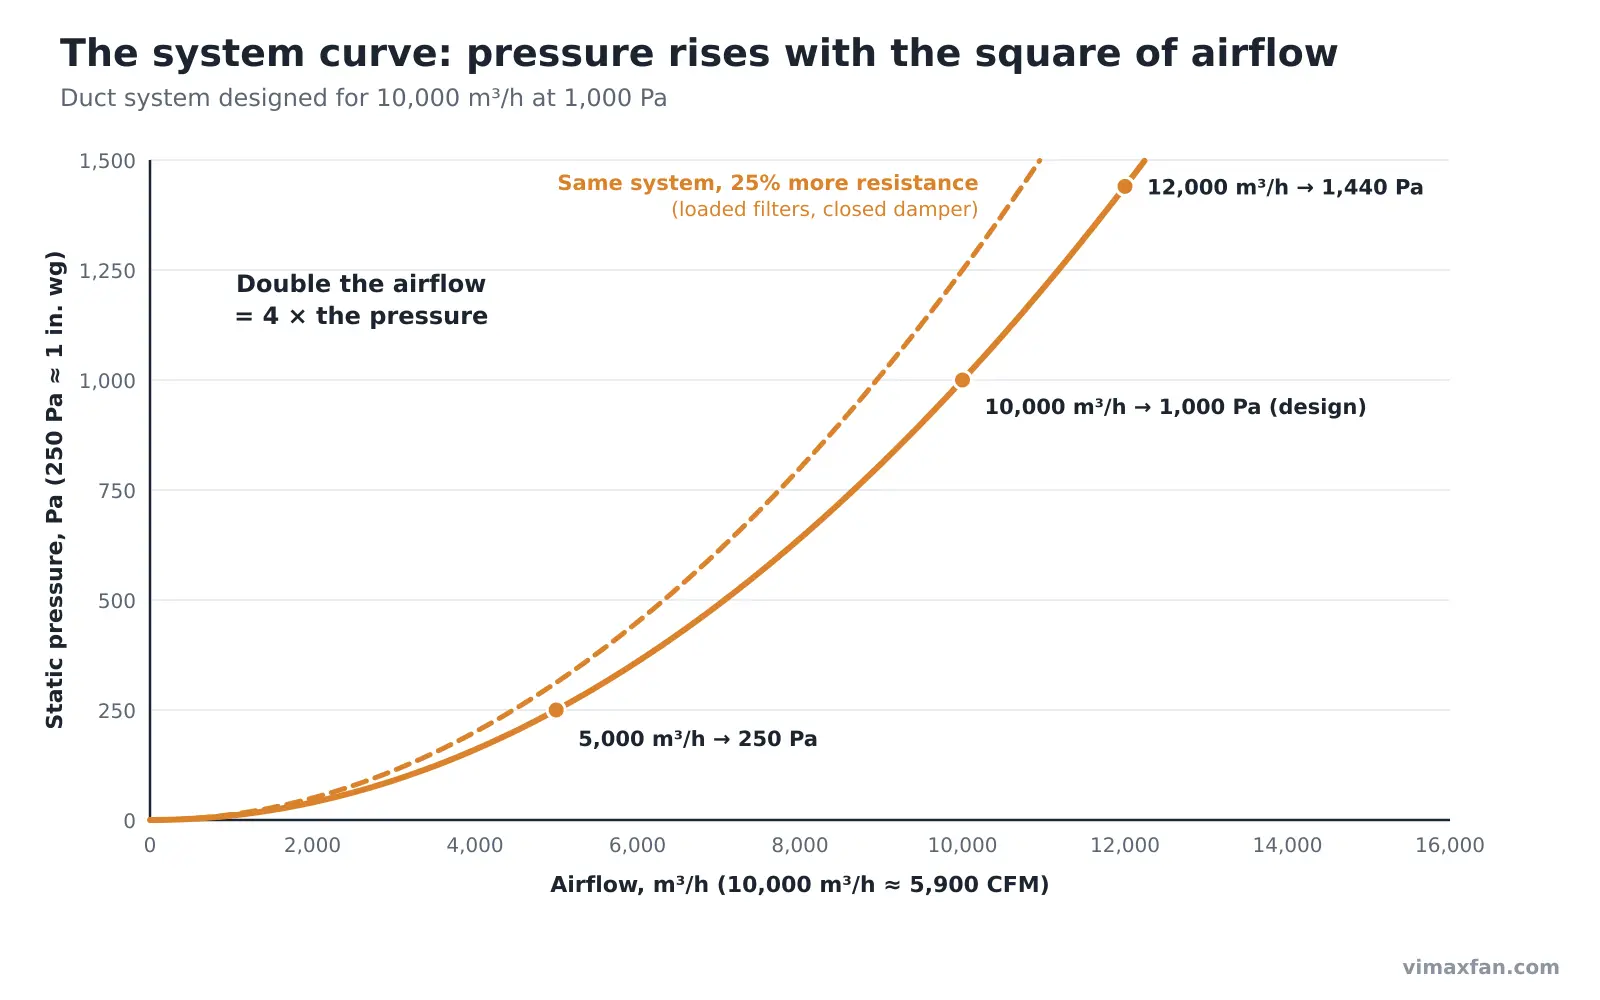
Using the example system designed for 10,000 m³/h at 1,000 Pa:
| Airflow | Calculation | System pressure |
| 5,000 m³/h (2,940 CFM) | 1,000 × (5,000 / 10,000)² | 250 Pa (1.0 in. wg) |
| 10,000 m³/h (5,890 CFM) | design point | 1,000 Pa (4.0 in. wg) |
| 12,000 m³/h (7,060 CFM) | 1,000 × (12,000 / 10,000)² | 1,440 Pa (5.8 in. wg) |
Asking for 20% more air needs 44% more pressure. That is why “just add a bit of airflow” to an existing system usually needs a bigger fan or a higher speed, not a small adjustment.
The system curve is not fixed for life. As bag or cartridge filters load with dust, as dampers are closed, or when someone adds a branch duct, the curve becomes steeper (the dashed line in Figure 2). Systems with variable air volume boxes or a fixed pressure set point also have a curve that does not start at zero; for those, the pressure the controls hold must be added to the square-law part.
Getting the design point right is the job of the duct calculation. The most common errors are a missing component (an inlet louvre, a spark arrestor, a stack cap), filter losses taken at the clean value instead of the final value, and no allowance for system effect at the fan inlet and outlet.
Finding the Operating Point
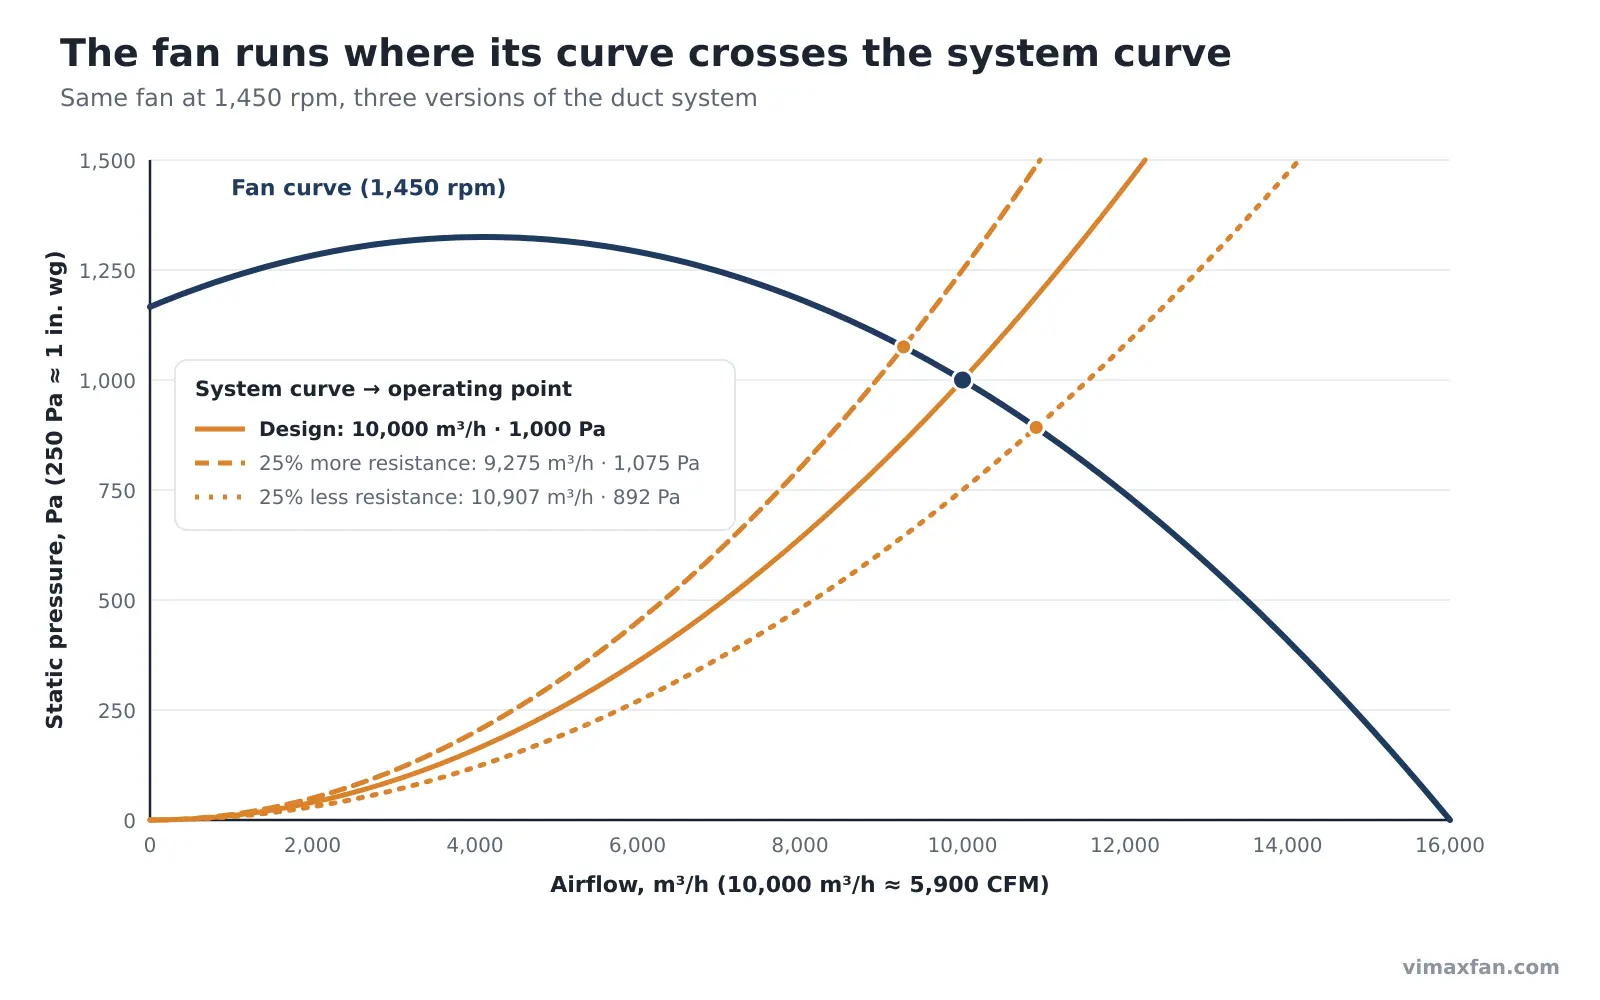
A fan cannot run anywhere on its curve it likes. At any moment the pressure it develops must equal the pressure the system consumes, so the fan settles where the fan curve and the system curve cross. That intersection is the operating point, and it decides the real airflow, pressure, power and efficiency.
Worked example: reading the curve step by step
A factory exhaust system needs 10,000 m³/h (≈ 5,890 CFM) at 1,000 Pa (≈ 4.0 in. wg) static pressure, standard air. The candidate is the example fan in Figure 1, running at 1,450 rpm.
- Find the airflow. Locate 10,000 m³/h on the horizontal axis.
- Read the fan pressure. Go straight up to the fan curve and read across: 1,000 Pa. The fan meets the duty at this speed.
- Draw the system curve. Plot the design point and the square-law curve through it (Figure 2). It crosses the fan curve at 10,000 m³/h and 1,000 Pa — the operating point.
- Read efficiency and power. At 10,000 m³/h the example fan runs at about 77.5% static efficiency and needs about 3.6 kW at the shaft. As a check: air power = 2.78 m³/s × 1,000 Pa = 2.78 kW; 2.78 / 0.775 ≈ 3.6 kW.
- Check the position. The point is well right of the pressure peak (about 4,100 m³/h) and close to the best efficiency point (about 9,300 m³/h). This is a good selection.
- Size the motor on the power curve, not the duty point. This fan’s power curve peaks at about 3.6 kW, so the motor will not overload anywhere on the curve. Allow for drive losses on a belt-driven fan and for the gas density at the coldest operating condition.
- Test what happens if the system is wrong. Move the system curve up and down by 25% and read the new intersections:
| System as built | Airflow | Static pressure | Change in airflow |
| As designed | 10,000 m³/h | 1,000 Pa | — |
| 25% more resistance (dirty filters, undersized duct) | 9,275 m³/h | 1,075 Pa | −7% |
| 25% less resistance (over-estimated losses) | 10,907 m³/h | 892 Pa | +9% |
Two lessons from the table. First, a 25% error in calculated resistance shifts airflow by less than 10% on this steep part of the fan curve — a fan with a flatter curve would lose much more airflow. Second, because this backward-curved fan’s power peaks near the design point, the motor stays safe when resistance is lower than expected. A forward-curved or radial fan in the same situation would draw more power and could trip its overload.
Changing Speed: The Fan Laws
Every fan curve is drawn for one speed. Change the speed — with a different pulley ratio or a variable-frequency drive (VFD) — and the whole curve moves according to the fan laws:
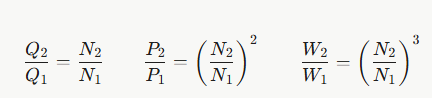
where Q is airflow, P pressure, W shaft power and N speed.
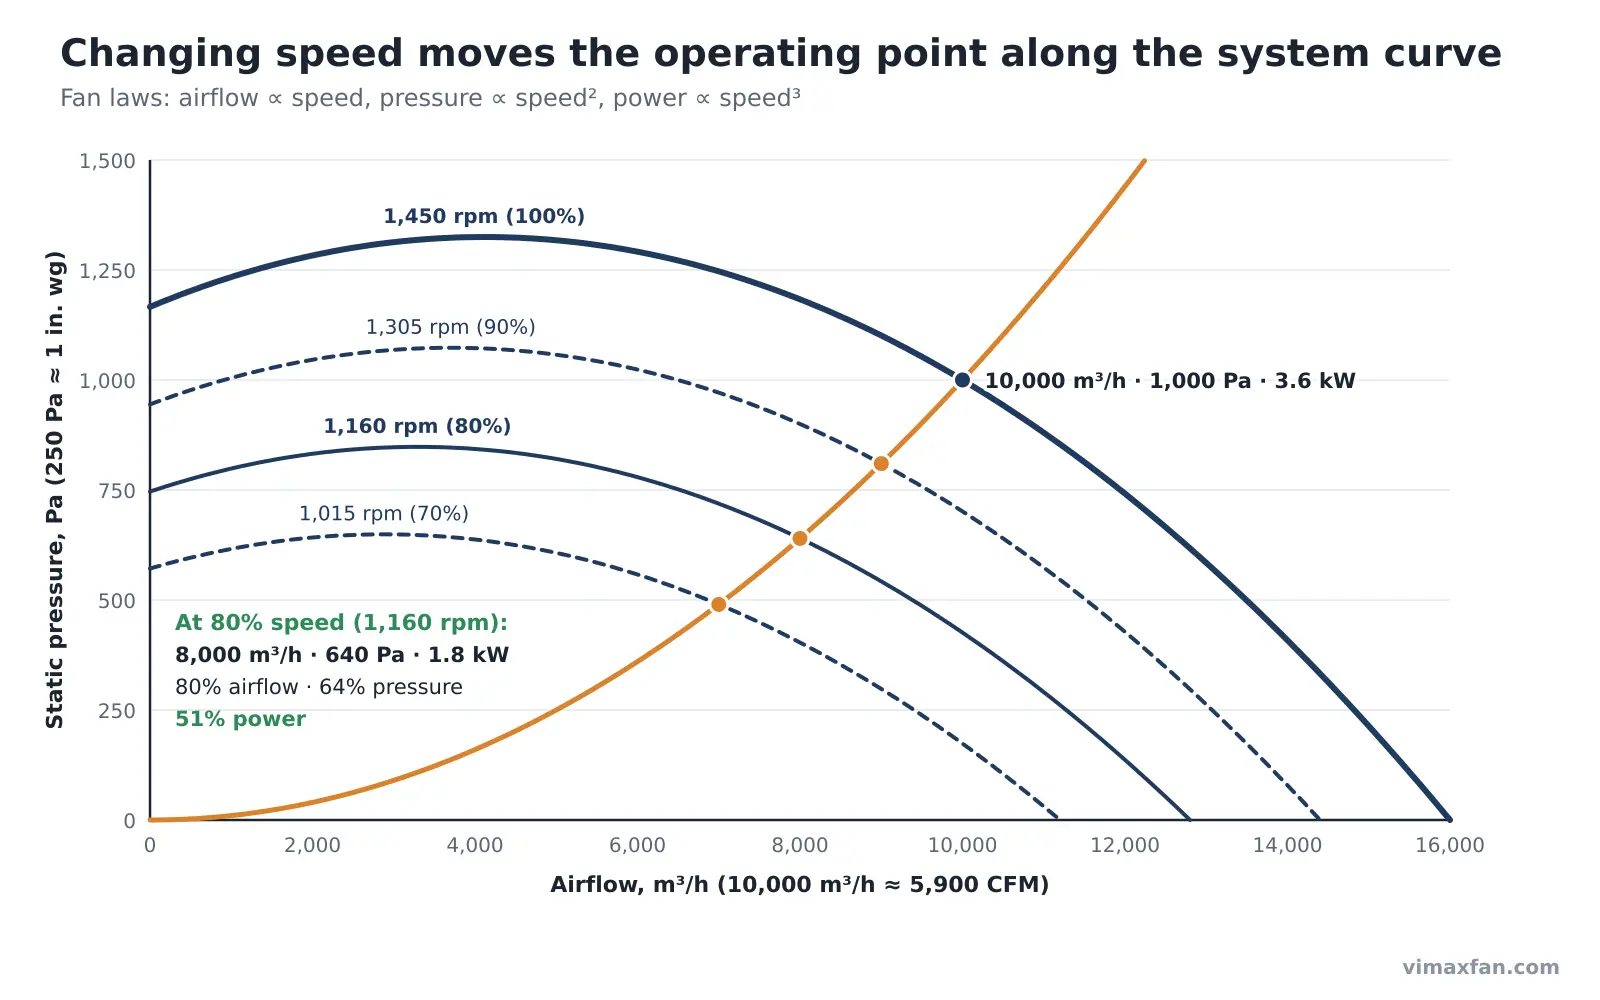
Applied to the example system:
| Speed | Airflow | Static pressure | Shaft power |
| 1,450 rpm (100%) | 10,000 m³/h | 1,000 Pa | 3.6 kW |
| 1,305 rpm (90%) | 9,000 m³/h | 810 Pa | 2.6 kW |
| 1,160 rpm (80%) | 8,000 m³/h | 640 Pa | 1.8 kW |
| 1,015 rpm (70%) | 7,000 m³/h | 490 Pa | 1.2 kW |
Reducing airflow by 20% with speed control cuts fan shaft power roughly in half. Throttling the same fan with a damper to 8,000 m³/h would keep it near full speed and save far less, because the damper simply burns the surplus pressure. This cube law is the reason VFDs pay back quickly on fans that run at part load for long hours.
Where the fan laws stop being exact
- Systems with a fixed pressure component (a VAV system holding duct pressure, a process that needs a minimum suction) do not follow a pure square-law curve, so real savings are smaller than the cube law predicts.
- Motor and drive efficiency fall at low load, so the electrical saving is a little less than the shaft-power saving.
- Large speed increases run into mechanical limits: always check the fan’s maximum safe speed and the motor’s rating before speeding a fan up.
Air density works the same way. Pressure and power change in proportion to gas density, while the volume flow at a given speed stays the same. Air at 150 °C has a density of about 0.83 kg/m³, roughly 69% of standard air, so the same fan at the same speed develops only about 69% of its catalogue pressure. Hot-gas fans must be selected at the actual temperature — and the motor sized for cold start-up, when the gas is densest. See our guide to heat- and corrosion-resistant fans for material limits.
Common Mistakes When Reading Fan Curves
Most field complaints of “the fan is undersized” trace back to one of these six mistakes, not to the fan itself.
- Mixing static and total pressure. Comparing one supplier’s static-pressure curve with another’s total-pressure curve makes the second fan look stronger than it is. Ask for the same basis from every supplier.
- Ignoring system effect. Catalogue curves are measured with ideal inlet and outlet ducts. An elbow bolted straight onto the fan inlet, or a short outlet duct, reduces real performance. Common guidance is to keep elbows at least three duct diameters upstream of the inlet and to provide about 2.5 equivalent duct diameters of straight duct at the outlet (more at high outlet velocity); AMCA Publication 201 gives methods to estimate the loss when that is not possible. Badly designed inlet boxes have been observed to cut airflow by as much as 45%.
- Selecting left of the pressure peak. A fan chosen for a high pressure at low airflow may land in the unstable region, where it surges, vibrates and wears out bearings.
- Forgetting density. A fan for 150 °C flue gas or a site at 1,500 m altitude does not perform like the standard-air curve.
- Sizing the motor at the duty point only. Forward-curved and radial fans draw more power if the real system resistance is lower than designed. Read power at the highest airflow the system can reach.
- Using an old or generic curve. Curves are specific to the fan size, impeller type, speed and inlet configuration. Ask for the curve of the exact model, ideally from a test to AMCA 210 or ISO 5801.
Fans in parallel and in series
Two identical fans in parallel add their airflows at the same pressure; two in series add their pressures at the same airflow. On a real square-law system, neither arrangement doubles the result: the combined curve crosses the system curve at less than twice the single-fan airflow. Parallel fans with an unstable region can also “hunt”, one fan taking the load from the other — another reason to select right of the peak.
A quick checklist for selecting a fan from its curve
- Design airflow and static pressure confirmed, including filters at their final (dirty) loss
- Gas temperature, density and site altitude stated
- System effect allowed for at inlet and outlet
- Operating point right of the pressure peak, near best efficiency
- Effect of ±25% system resistance checked
- Motor sized on the power curve at the coldest gas condition
- Speed control (VFD) considered for part-load operation
- Curve supplied for the exact model, with the test standard named
Get Tested Fan Curves for Your Project
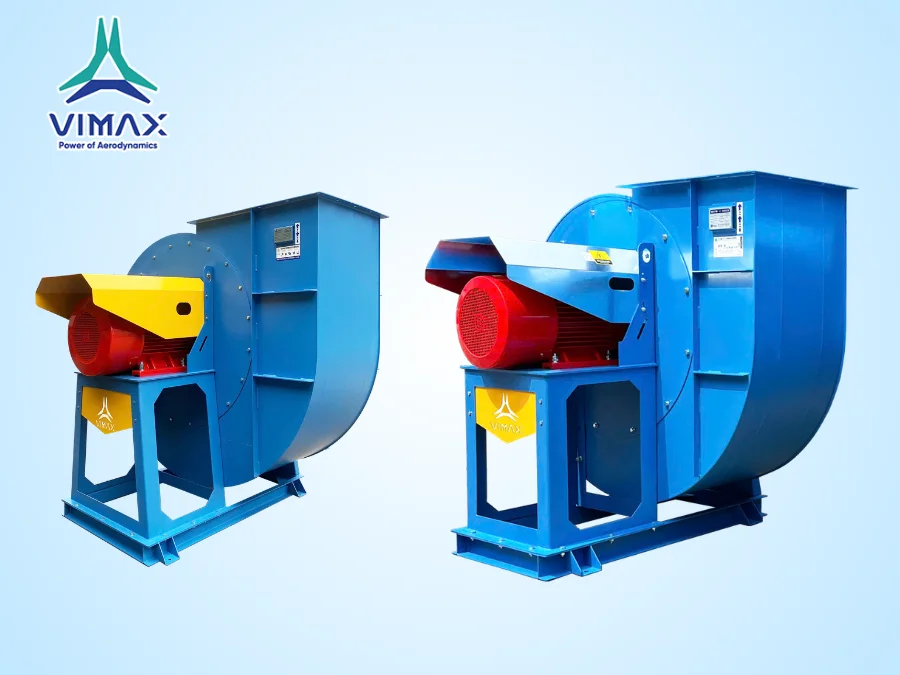
VIMAX GLOBAL manufactures industrial centrifugal fans and axial fans in Vietnam for export and OEM customers. Every selection comes with the fan curve for the exact model and speed, and our engineers check the operating point against your system before quoting. Performance is verified in our in-house testing area before shipment.
Send us your airflow, static pressure, gas temperature, altitude and a sketch of the inlet and outlet ductwork. We will return a recommended model with its curve, operating point, efficiency and motor size.
Request a fan selection and quote →
Frequently Asked Questions
What is the difference between a fan curve and a system curve?
A fan curve shows how much pressure a fan can produce at each airflow at a given speed. A system curve shows how much pressure the ductwork needs at each airflow. The fan operates where the two curves cross.
How do I find the operating point of a fan?
Plot the system curve through your design point using the square law (pressure changes with the square of airflow), overlay it on the fan curve, and read the airflow and pressure where they intersect. Then read efficiency and power at that airflow.
Why should a fan not be selected to the left of the pressure peak?
The region left of the peak is unstable. Airflow can surge, causing noise, vibration and pulsating loads on the blades and bearings. Select to the right of the peak, close to the best efficiency point.
What happens to airflow when filters get dirty?
Dirty filters make the system curve steeper, so the operating point moves left along the fan curve to lower airflow and slightly higher pressure. In our example, 25% more system resistance reduced airflow by about 7%.
How much energy does reducing fan speed save?
Fan shaft power changes with the cube of speed. On a system that follows the square law, running at 80% speed gives about 80% airflow for about 51% of the power. Real savings are somewhat lower when the system has a fixed pressure component or when motor and drive losses are included.
Should I compare fans on static pressure or total pressure?
Use the same basis for every fan. Static pressure is the usual basis for industrial exhaust and ventilation systems; total pressure includes the velocity pressure at the outlet and always reads higher.
